CLIMATE CHANGE -- Contrary Opinions.

Source Christophere Monckton, Sunday Telegraph 5/11/2006
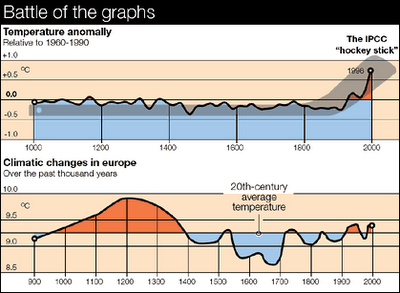
THE TOP CHART --- is the Famous "Hockey Stick" which ends with a dramatic take off
attributed to the the impact of the industrial revolution driven by greenhouse gases.
This is turn leads to the conclusion that we are getting close to trigger points and a catastrophic rise in temperature is in sight.
This warming in turn will trigger a rapid rise in sea levels and threaten hundreds of millions.
THE BOTTOM CHART --- is based on the fact that over time solar related forces have driven climate change of our planet. They always have, are now and always will.
This chart accounts for the Medival Warm Period ( when Iceland, New Zealand and Hawaii were settled) and The Little Ice Age (the hockey stick chart does not show this.)
In the last 400 years the solar irradiance and sunspot activity has rebounded from a 5,000 year low in the 1600s to a 1,000 year high to-day.
The open wounds in the ozone layer in the polar region may be adding to the warming.
